SnoutTime in the SnoutData apps
Series tables are Postgres tables, so any client can use them. The SnoutData desktop app and the SnoutData Cloud dashboard also know what SnoutTime (part of SnoutData Cloud) is, and show it: which tables are series, what state each partition is in, what sealing saved, and which rollups exist. Both read SnoutTime's own views, so nothing they show scans your data.
The desktop app
Connect to your Cloud project from the desktop app (every Cloud database appears in Connections by itself). What follows applies to any Postgres connection whose database has SnoutTime installed.
The explorer
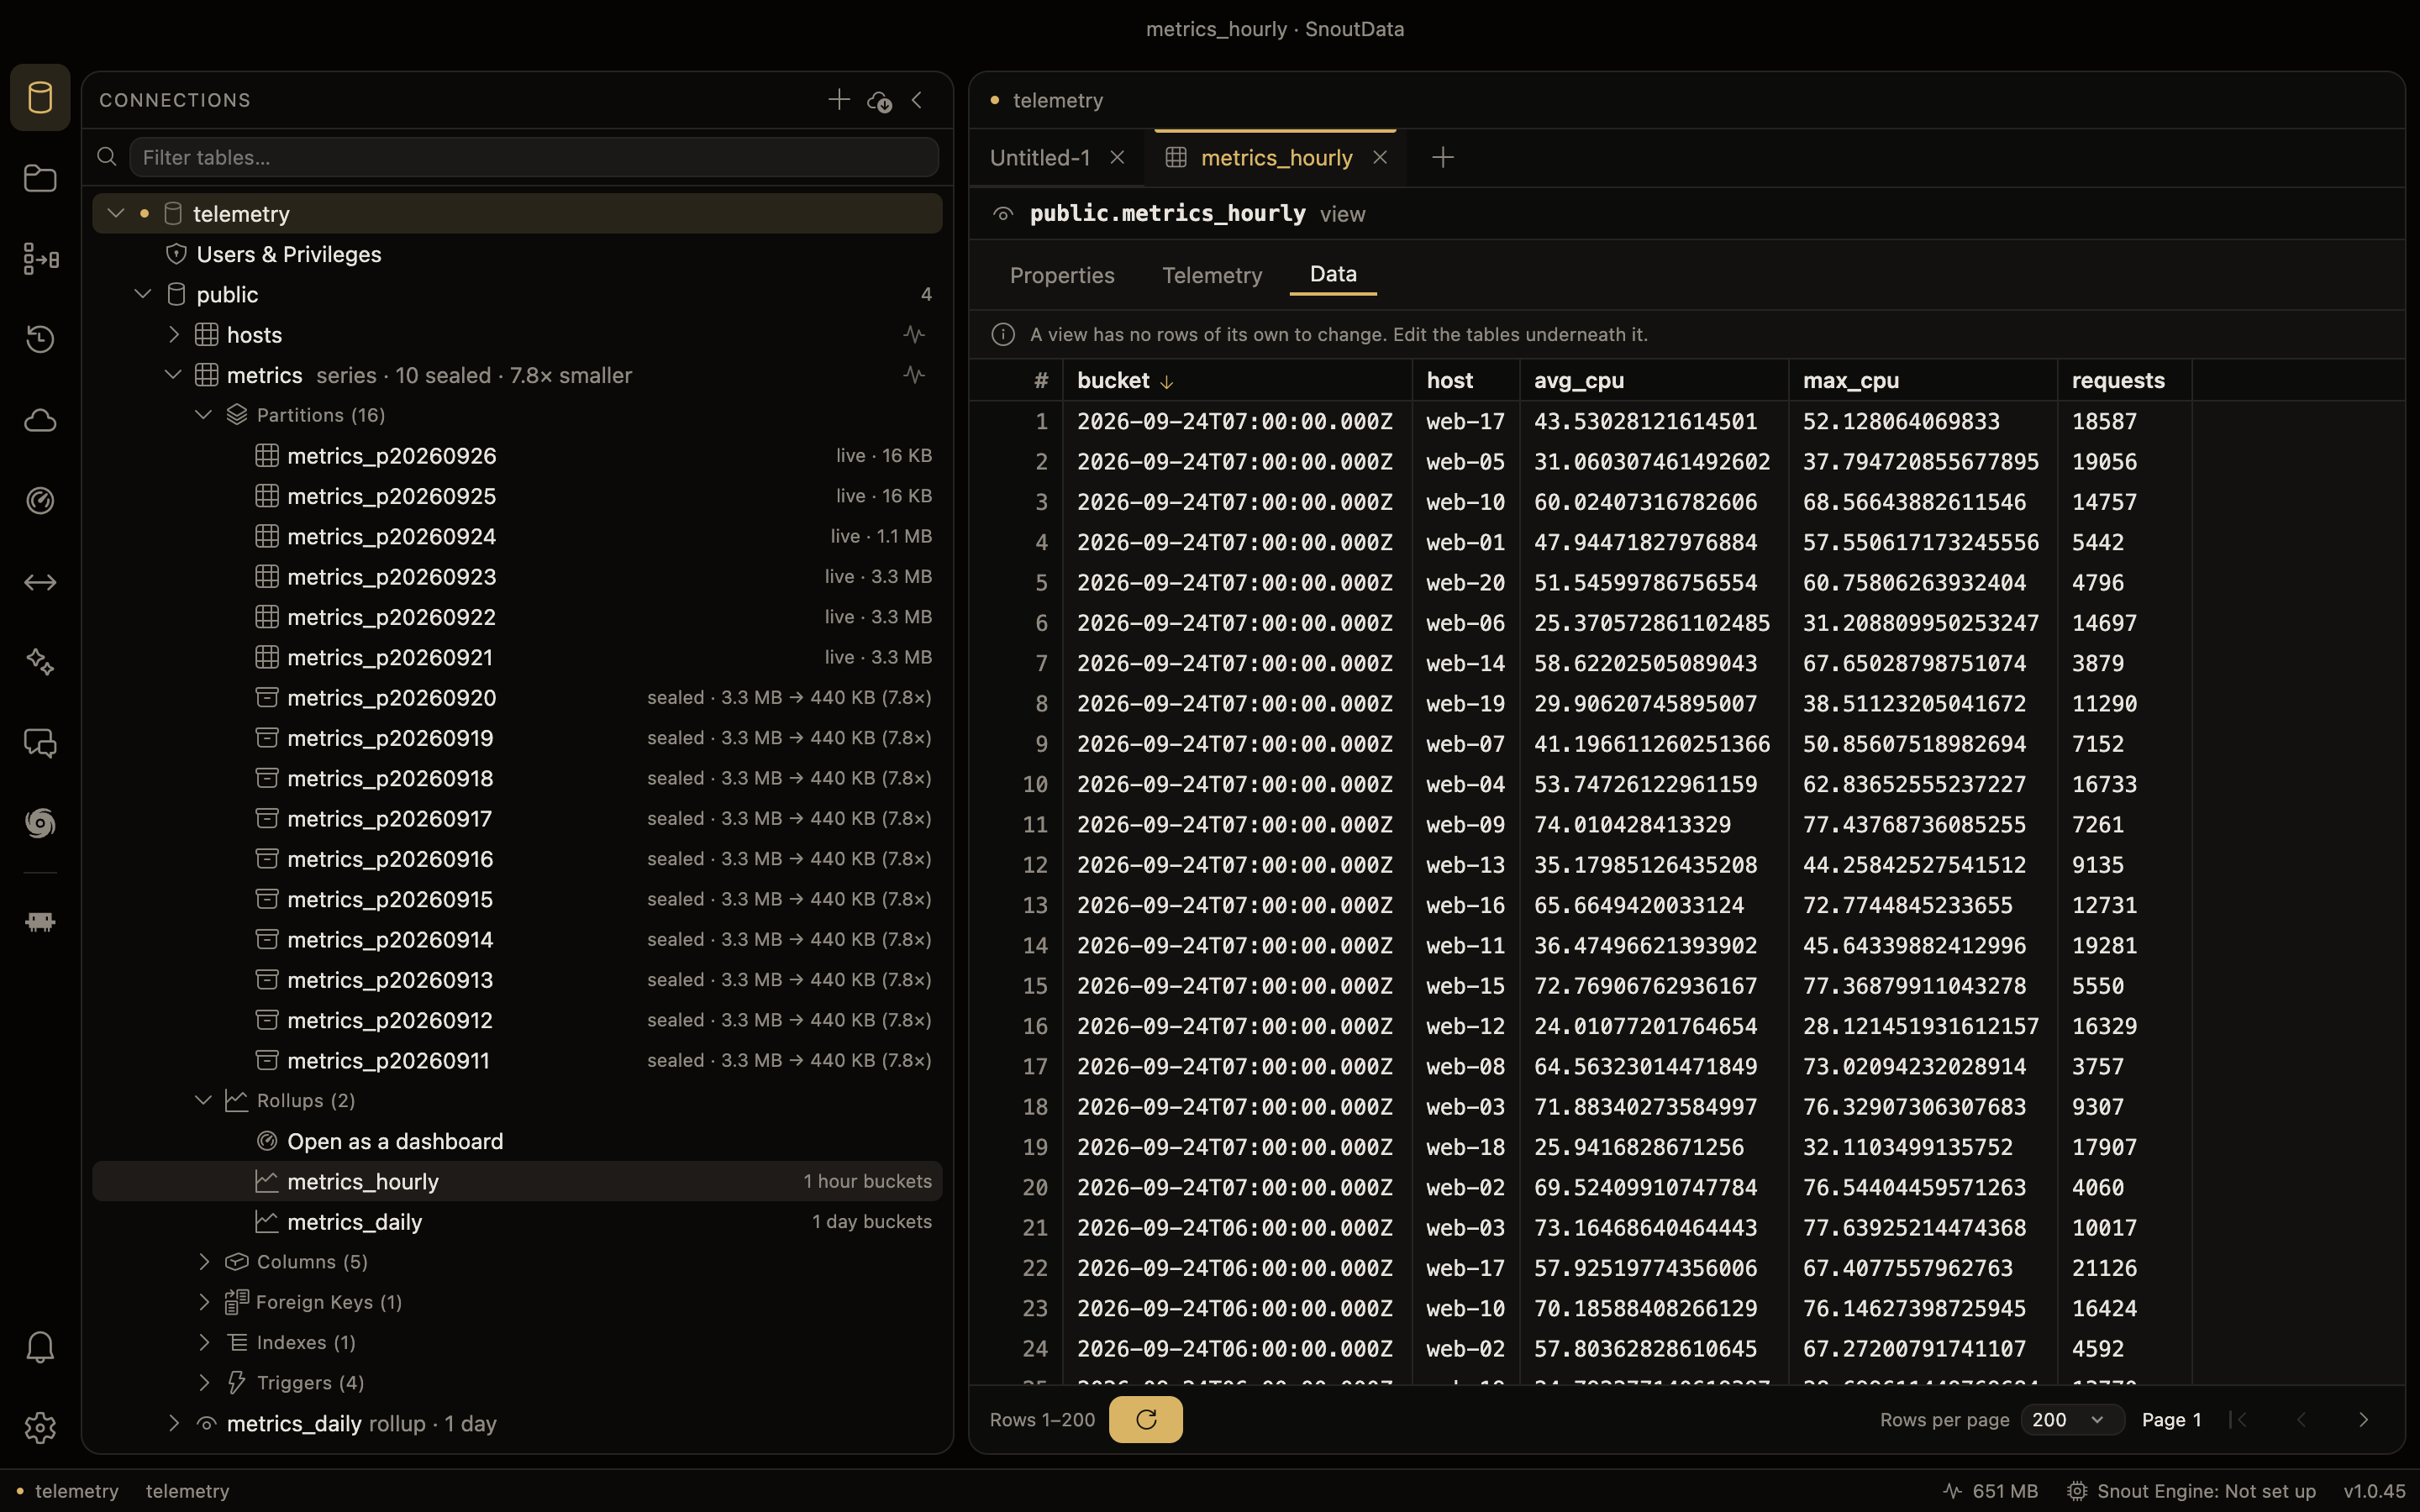
- A series table is marked as one. Beside its name the explorer shows
series, how many of its partitions are sealed, and how much smaller they are, in the formseries · <sealed partitions> sealed · <ratio>× smaller. A rollup is markedrollupwith its bucket size. - Partitions are folded under their table. Instead of a hundred
metrics_p2026...tables in the schema list, the table gets a Partitions folder, newest first. Each row shows the partition's state and size, and for a sealed one its size before and after, in the formsealed · <before> → <after> (<ratio>×). Hover over a row for its time range, its estimated row count and what its state means. Sealed partitions have an archive icon. Searching for a partition's name finds its table. - Rollups are listed under their table, in a Rollups folder, each with its bucket size.
- SnoutTime's internals stay out of the way. A rollup's
_materializedtable (read it through the rollup) and the delta stores and delete logs insnouttime_internalare not listed as your tables. On a SnoutData Cloud connection thesnouttimeschema itself (its catalog and jobs) is left out too, with the platform's other schemas; its views are still there to query, and Jobs and monitoring says what they hold. - A rollup opens newest bucket first, sorted by
bucketlike any other sort in the grid. - A plain partitioned table, SnoutTime or not, gets the same Partitions folder, listing its child tables.
The explorer refreshes itself when a partition is sealed, because the app watches each partition's storage as well as its columns.
Make a table a series in the table designer
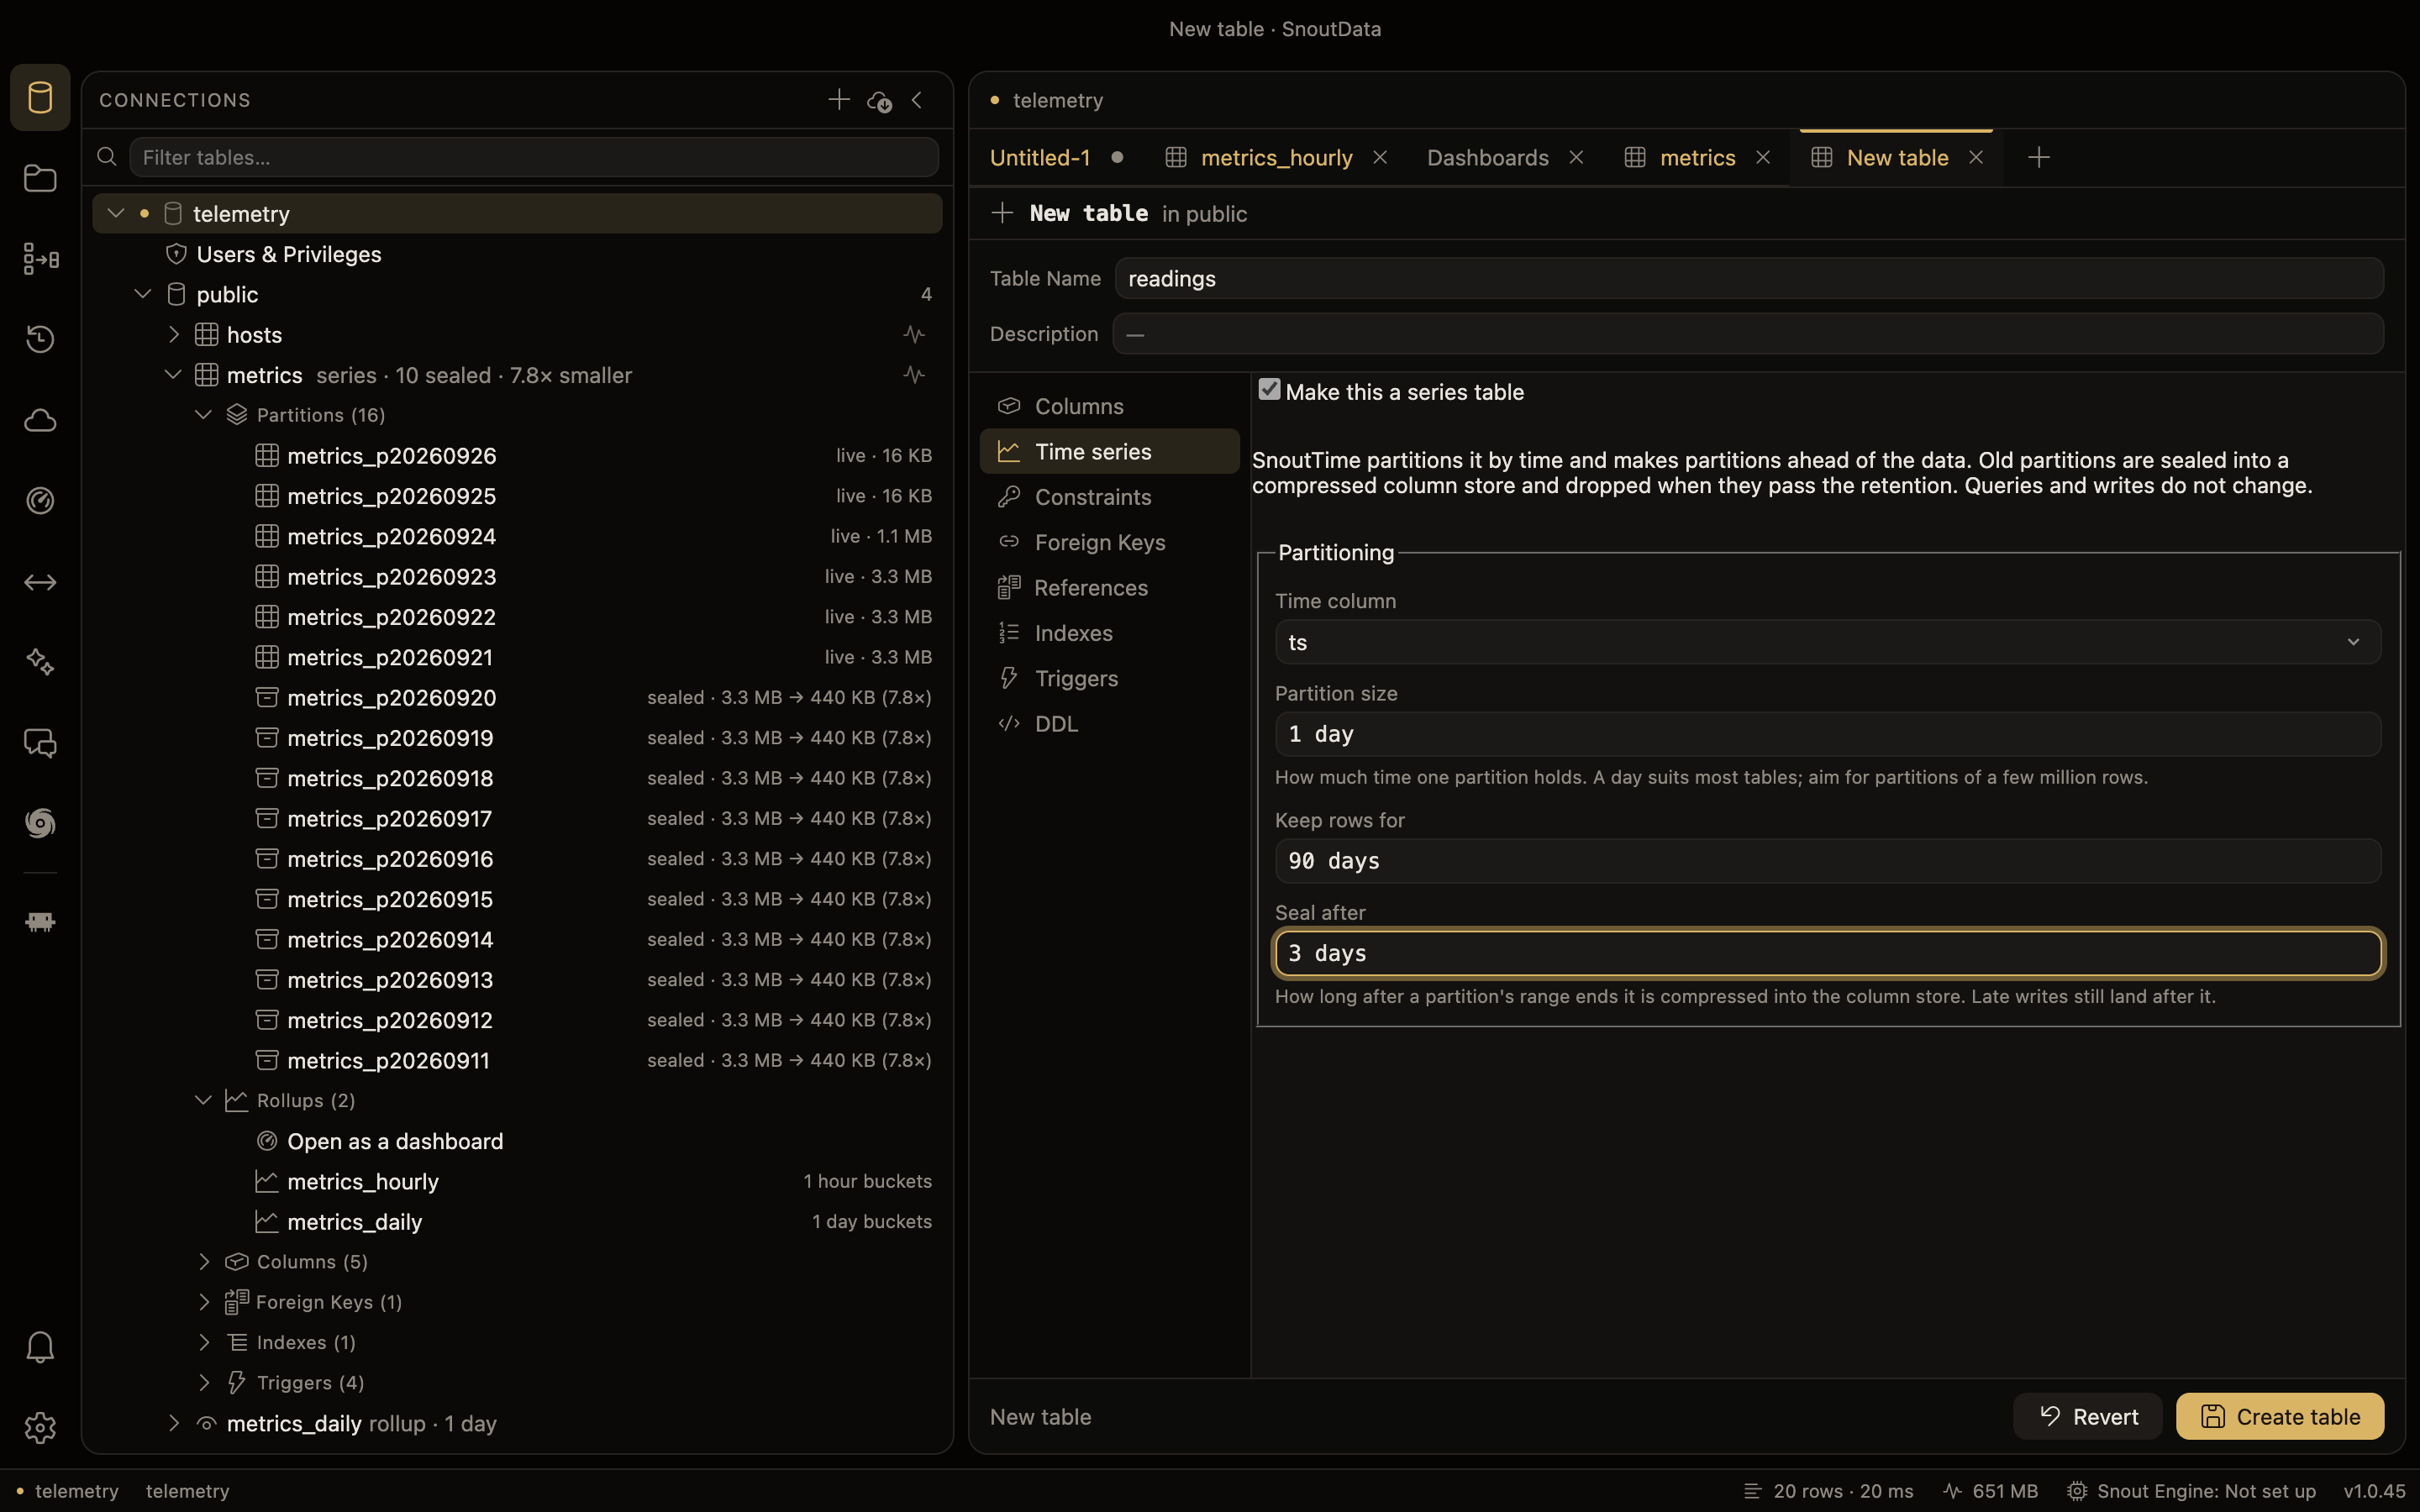
On a Postgres connection with SnoutTime installed, the table designer has a Time series section. Switch on Make this a series table, then fill in the Partitioning card:
- Time column: the column it is partitioned by. Timestamp and date columns are offered first, then integer ones.
- Partition size: how much time one partition holds, such as
1 day, or a width such as100000for an integer column. - Keep rows for: the retention. Empty keeps everything.
- Seal after: the settle window before a partition is sealed. Empty never seals.
When you apply, the designer runs its usual CREATE TABLE (or, for an existing table, its
ALTERs) followed by snouttime.create_series, snouttime.set_retention and
snouttime.set_sealing, and you can read every statement before it runs. It works on an existing
ordinary table too: its rows move into their partitions in the background. The two refusals a
first series table usually meets are said in the designer before anything runs: the time column
must be NOT NULL, and a primary key must include it.
On a table that is already a series, the section shows its shape (time column, partition size, number of partitions and what sealing saved) and lets you change Keep rows for. The time column and partition size are fixed once a series exists. The section is not offered on a partition, or on a table you partitioned by hand.
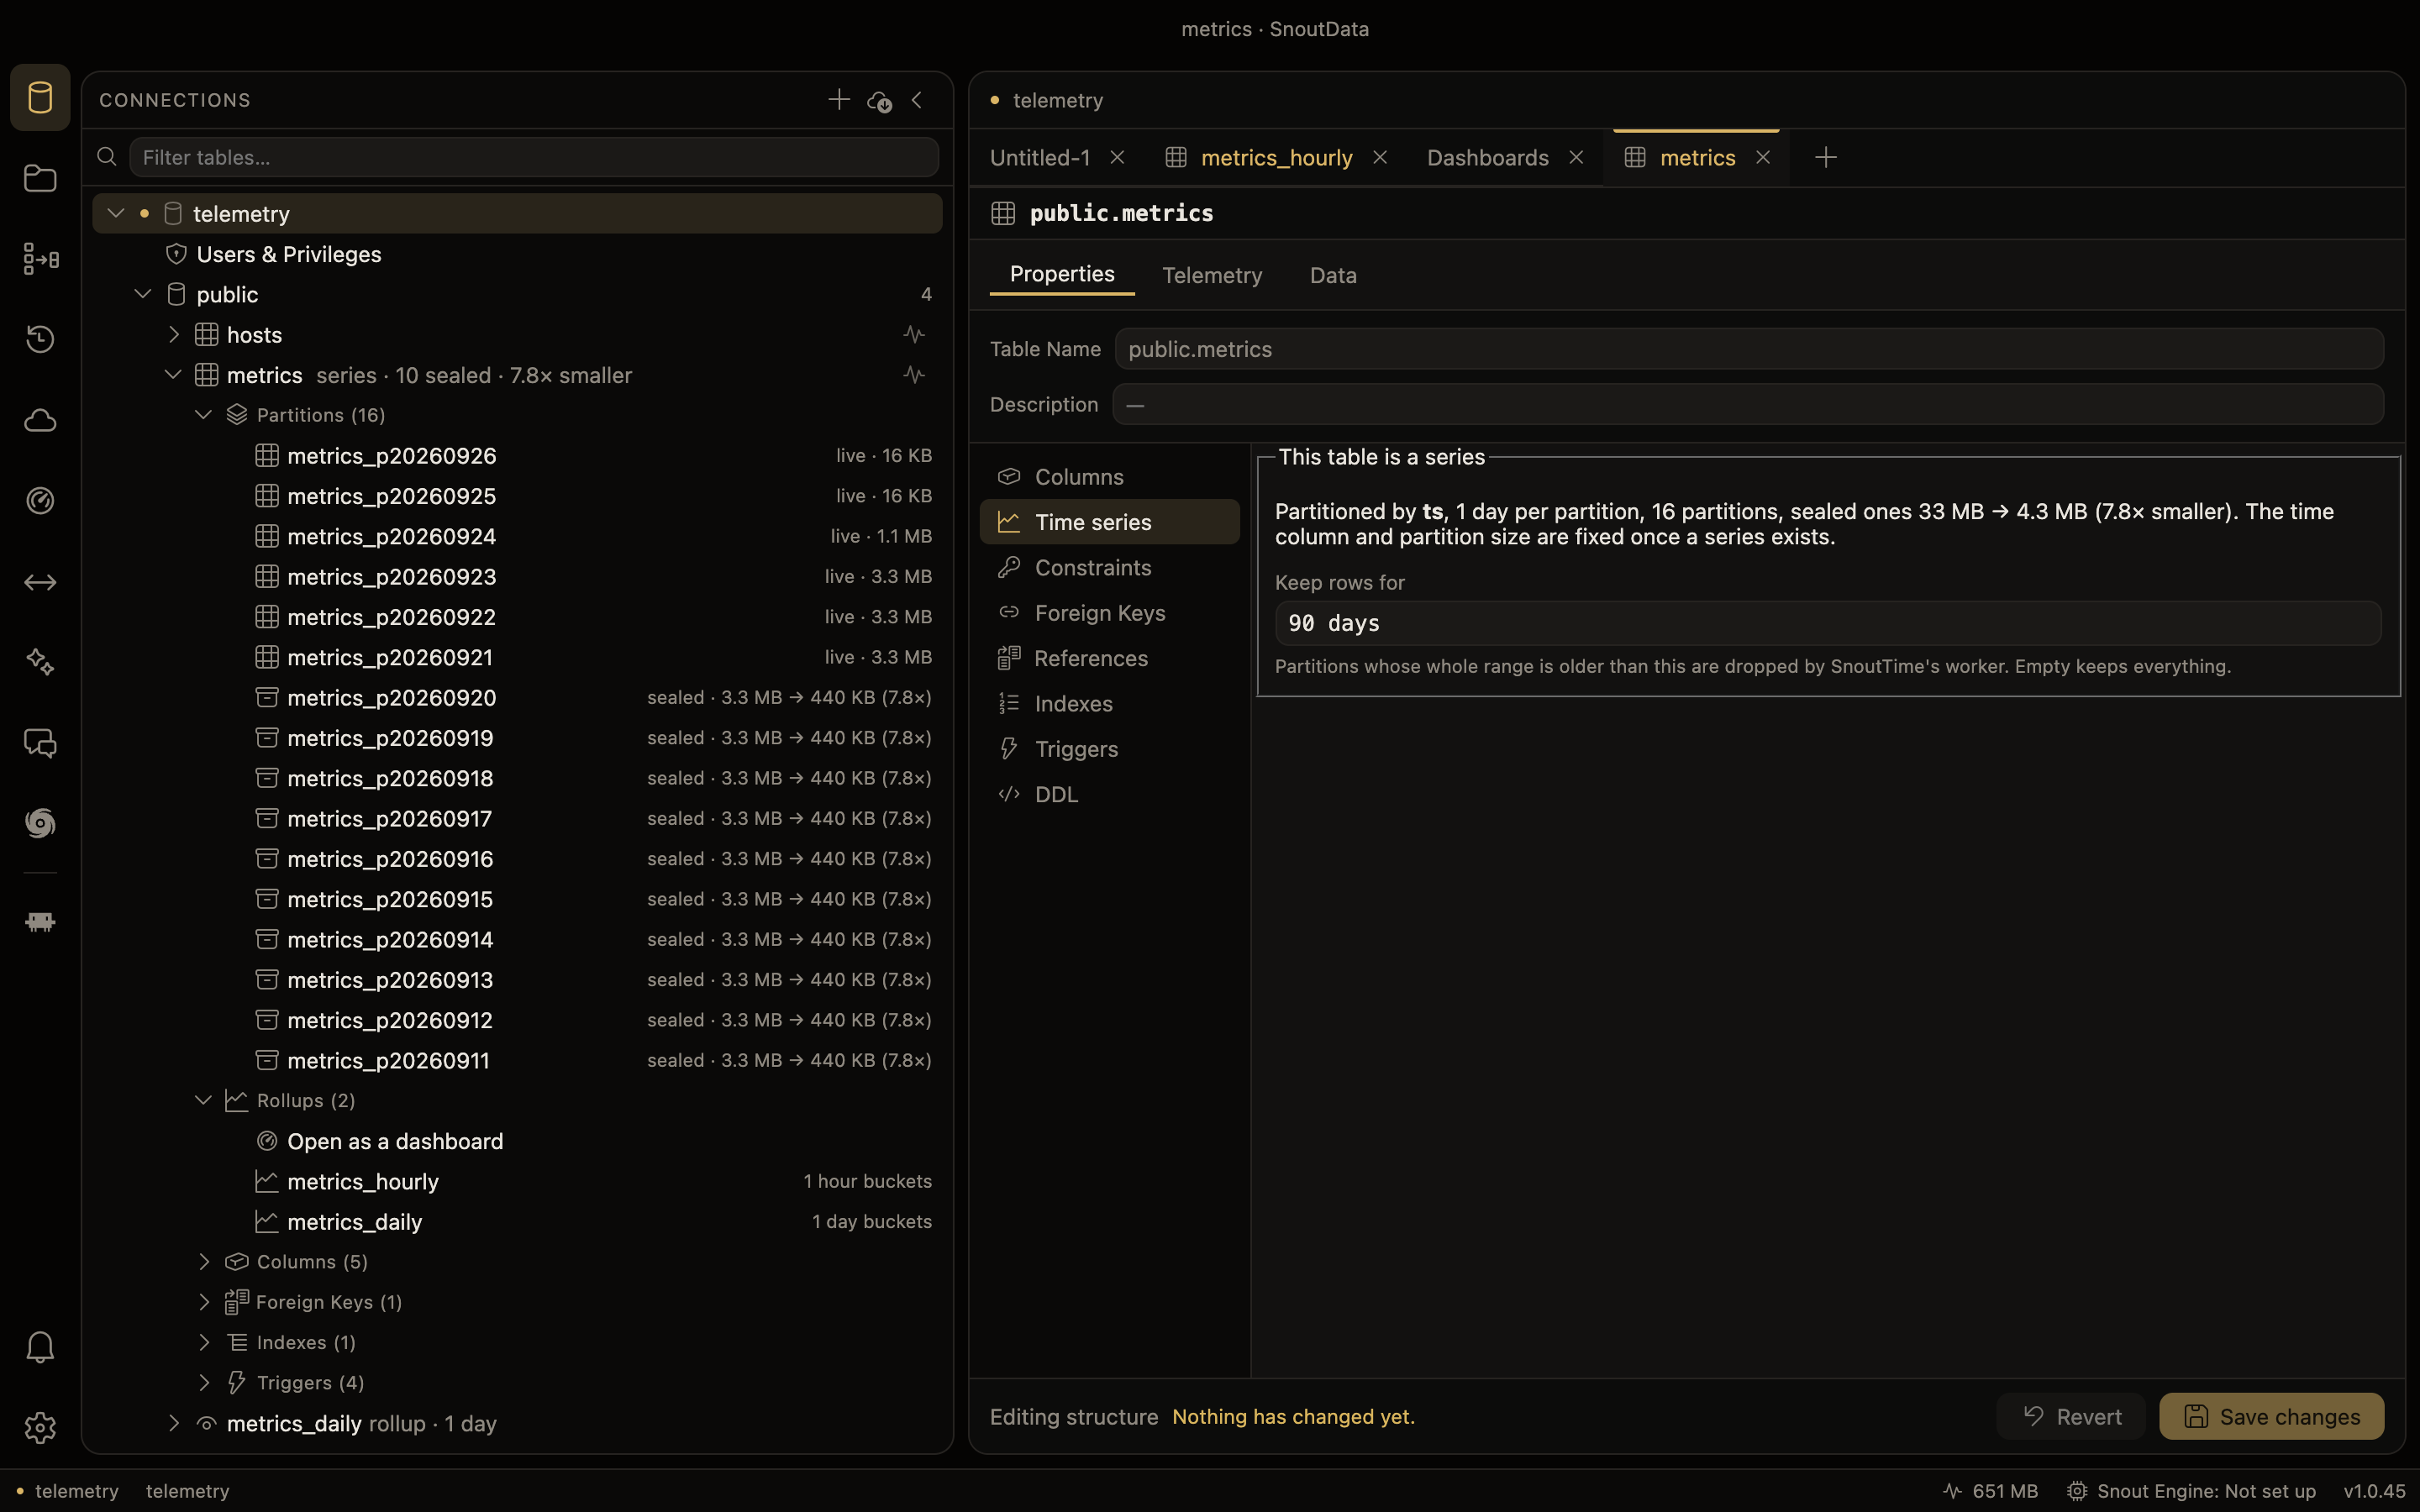
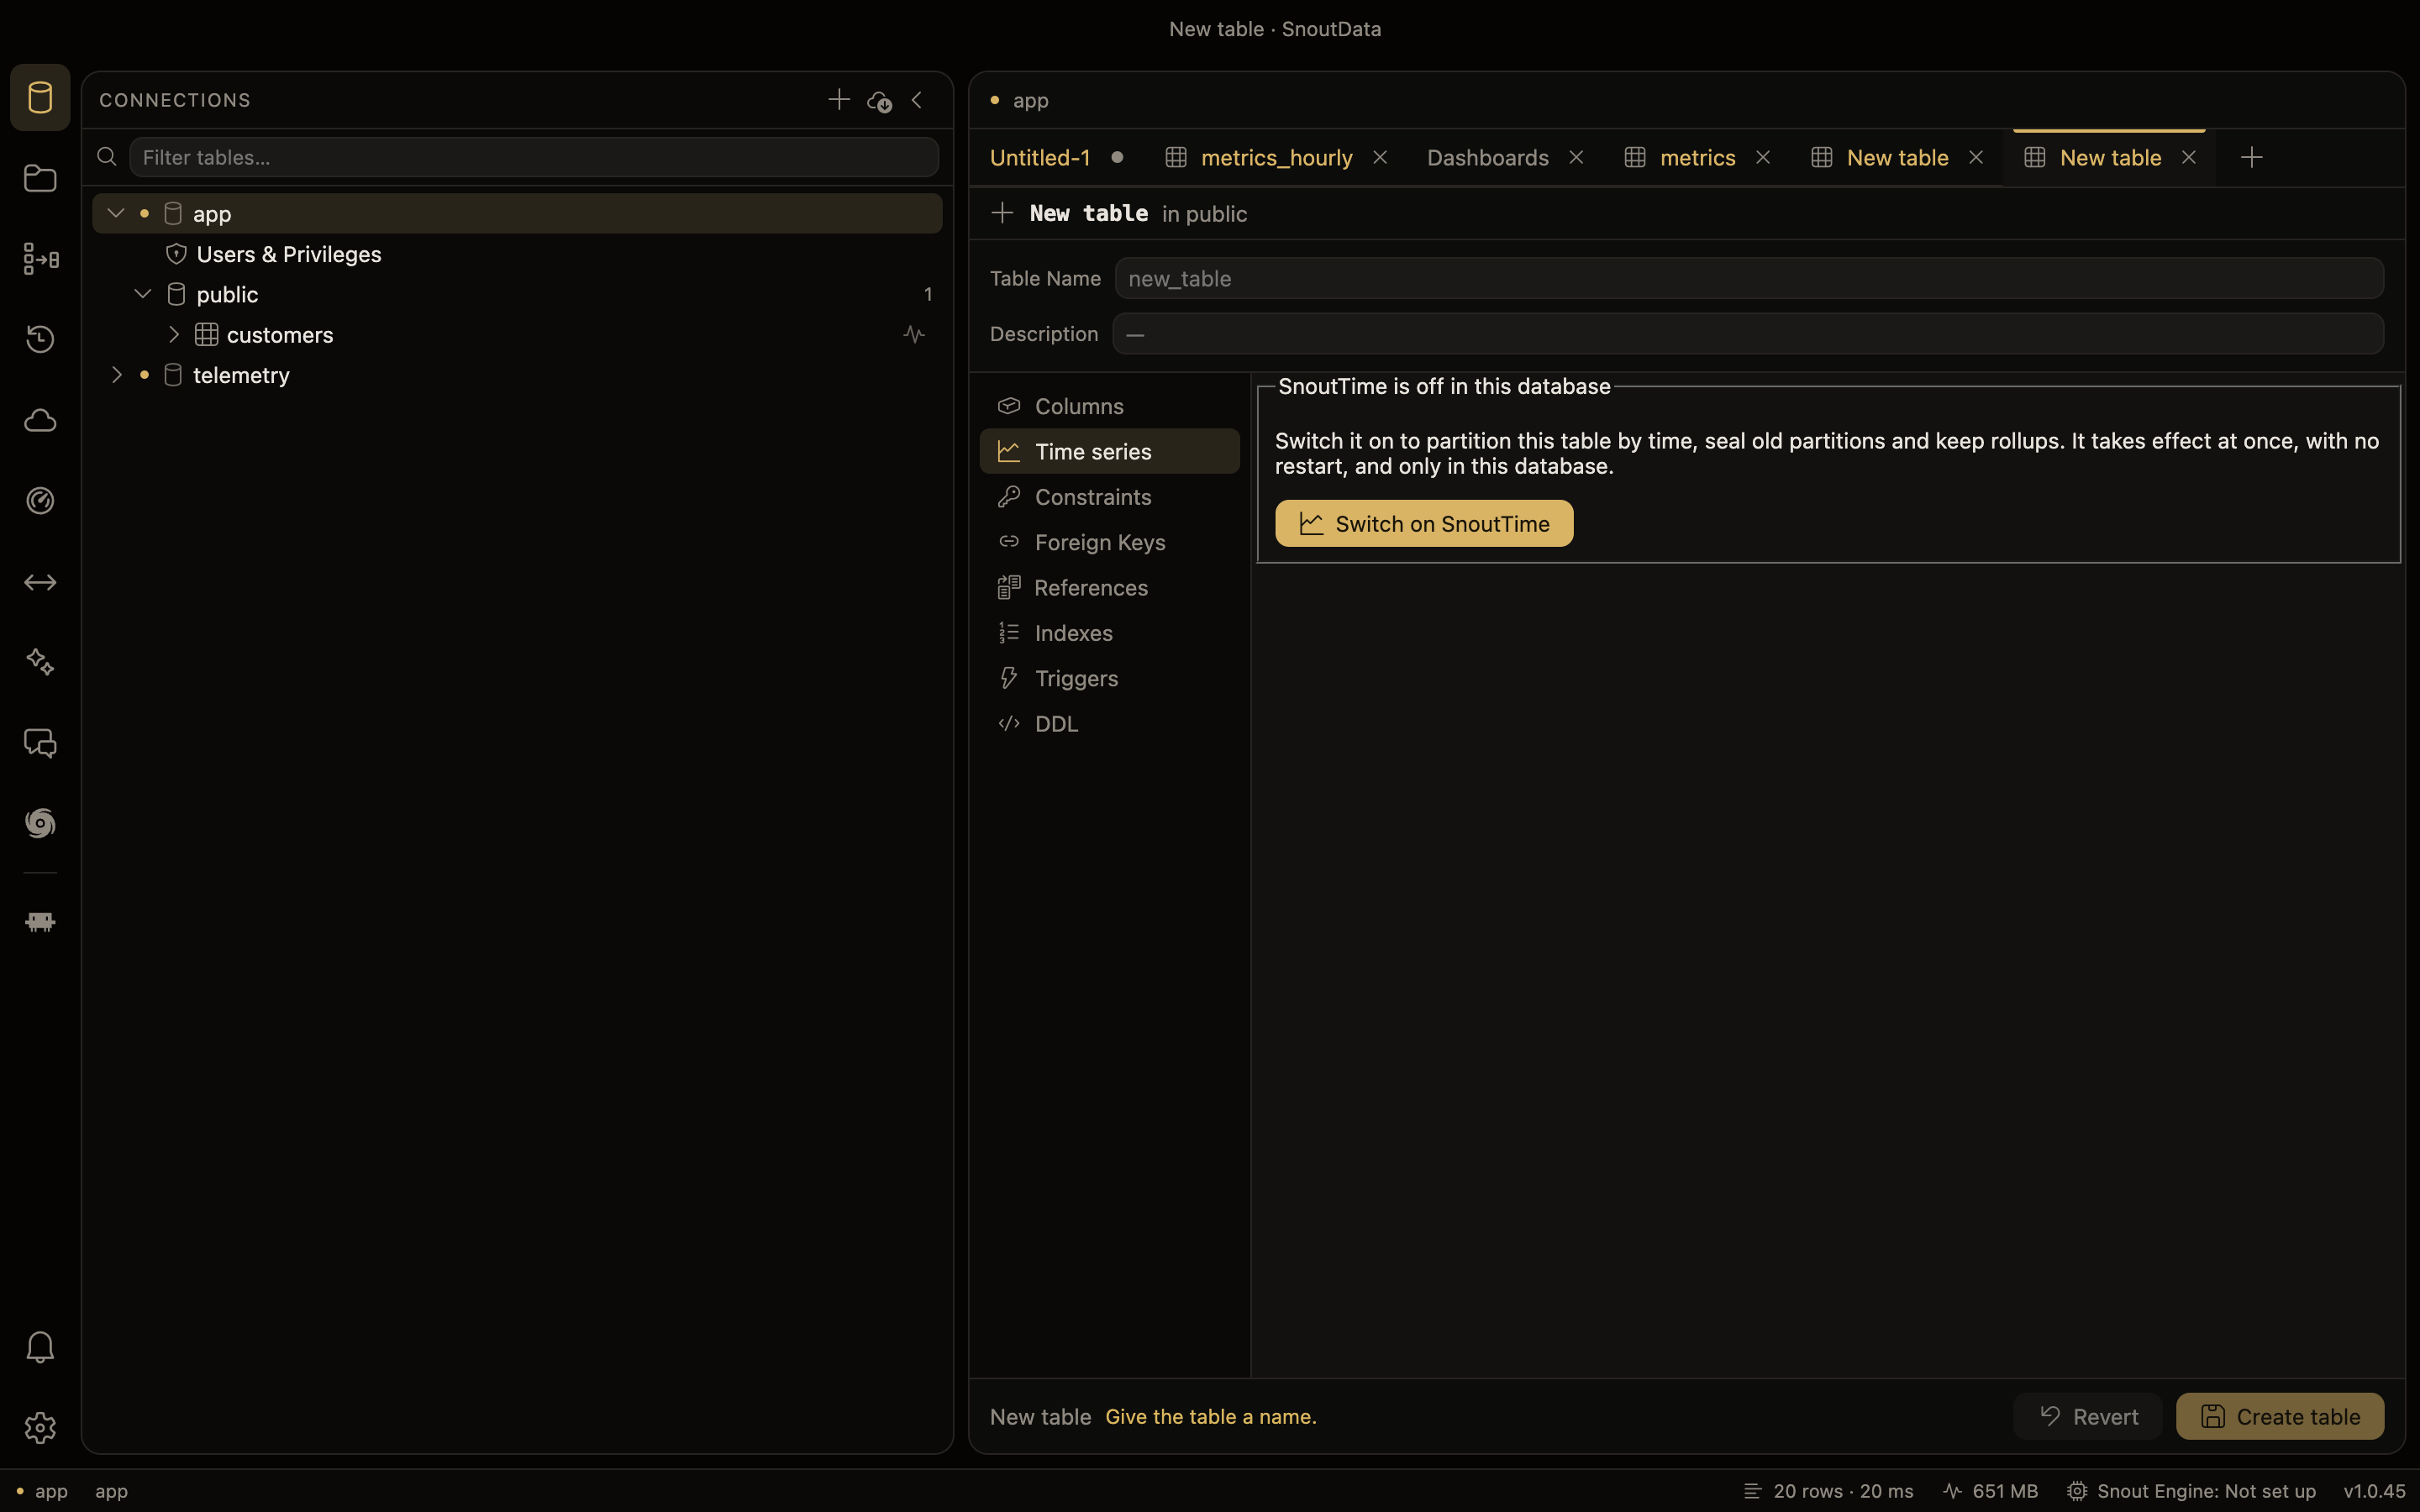
Where SnoutTime is not switched on in the database yet, the section says so and offers Switch on
SnoutTime, which shows you CREATE EXTENSION IF NOT EXISTS snouttime; in the same review sheet
before it runs. It takes effect at once, only in that database, with no restart.
The AI assistant and coding agents
The assistant's picture of your schema knows which tables are series and which are rollups:
- A series table is described with its time column, partition size, how many partitions are
sealed and its retention, together with the instruction to always filter on the time column
so the database skips partitions, and to bucket time with
snouttime.bucket. - Its rollups are named beside it, with the advice to read a rollup rather than aggregate the raw table when the rollup has what the question needs.
- Partitions and SnoutTime's own catalog are left out of the prompt, so a table with a hundred daily partitions does not crowd out the rest of your schema. Asked about a partition, the assistant is sent to its table.
The same grounding reaches a coding agent working through the app: a series is listed once, as a series.
A warning when a query reads every partition
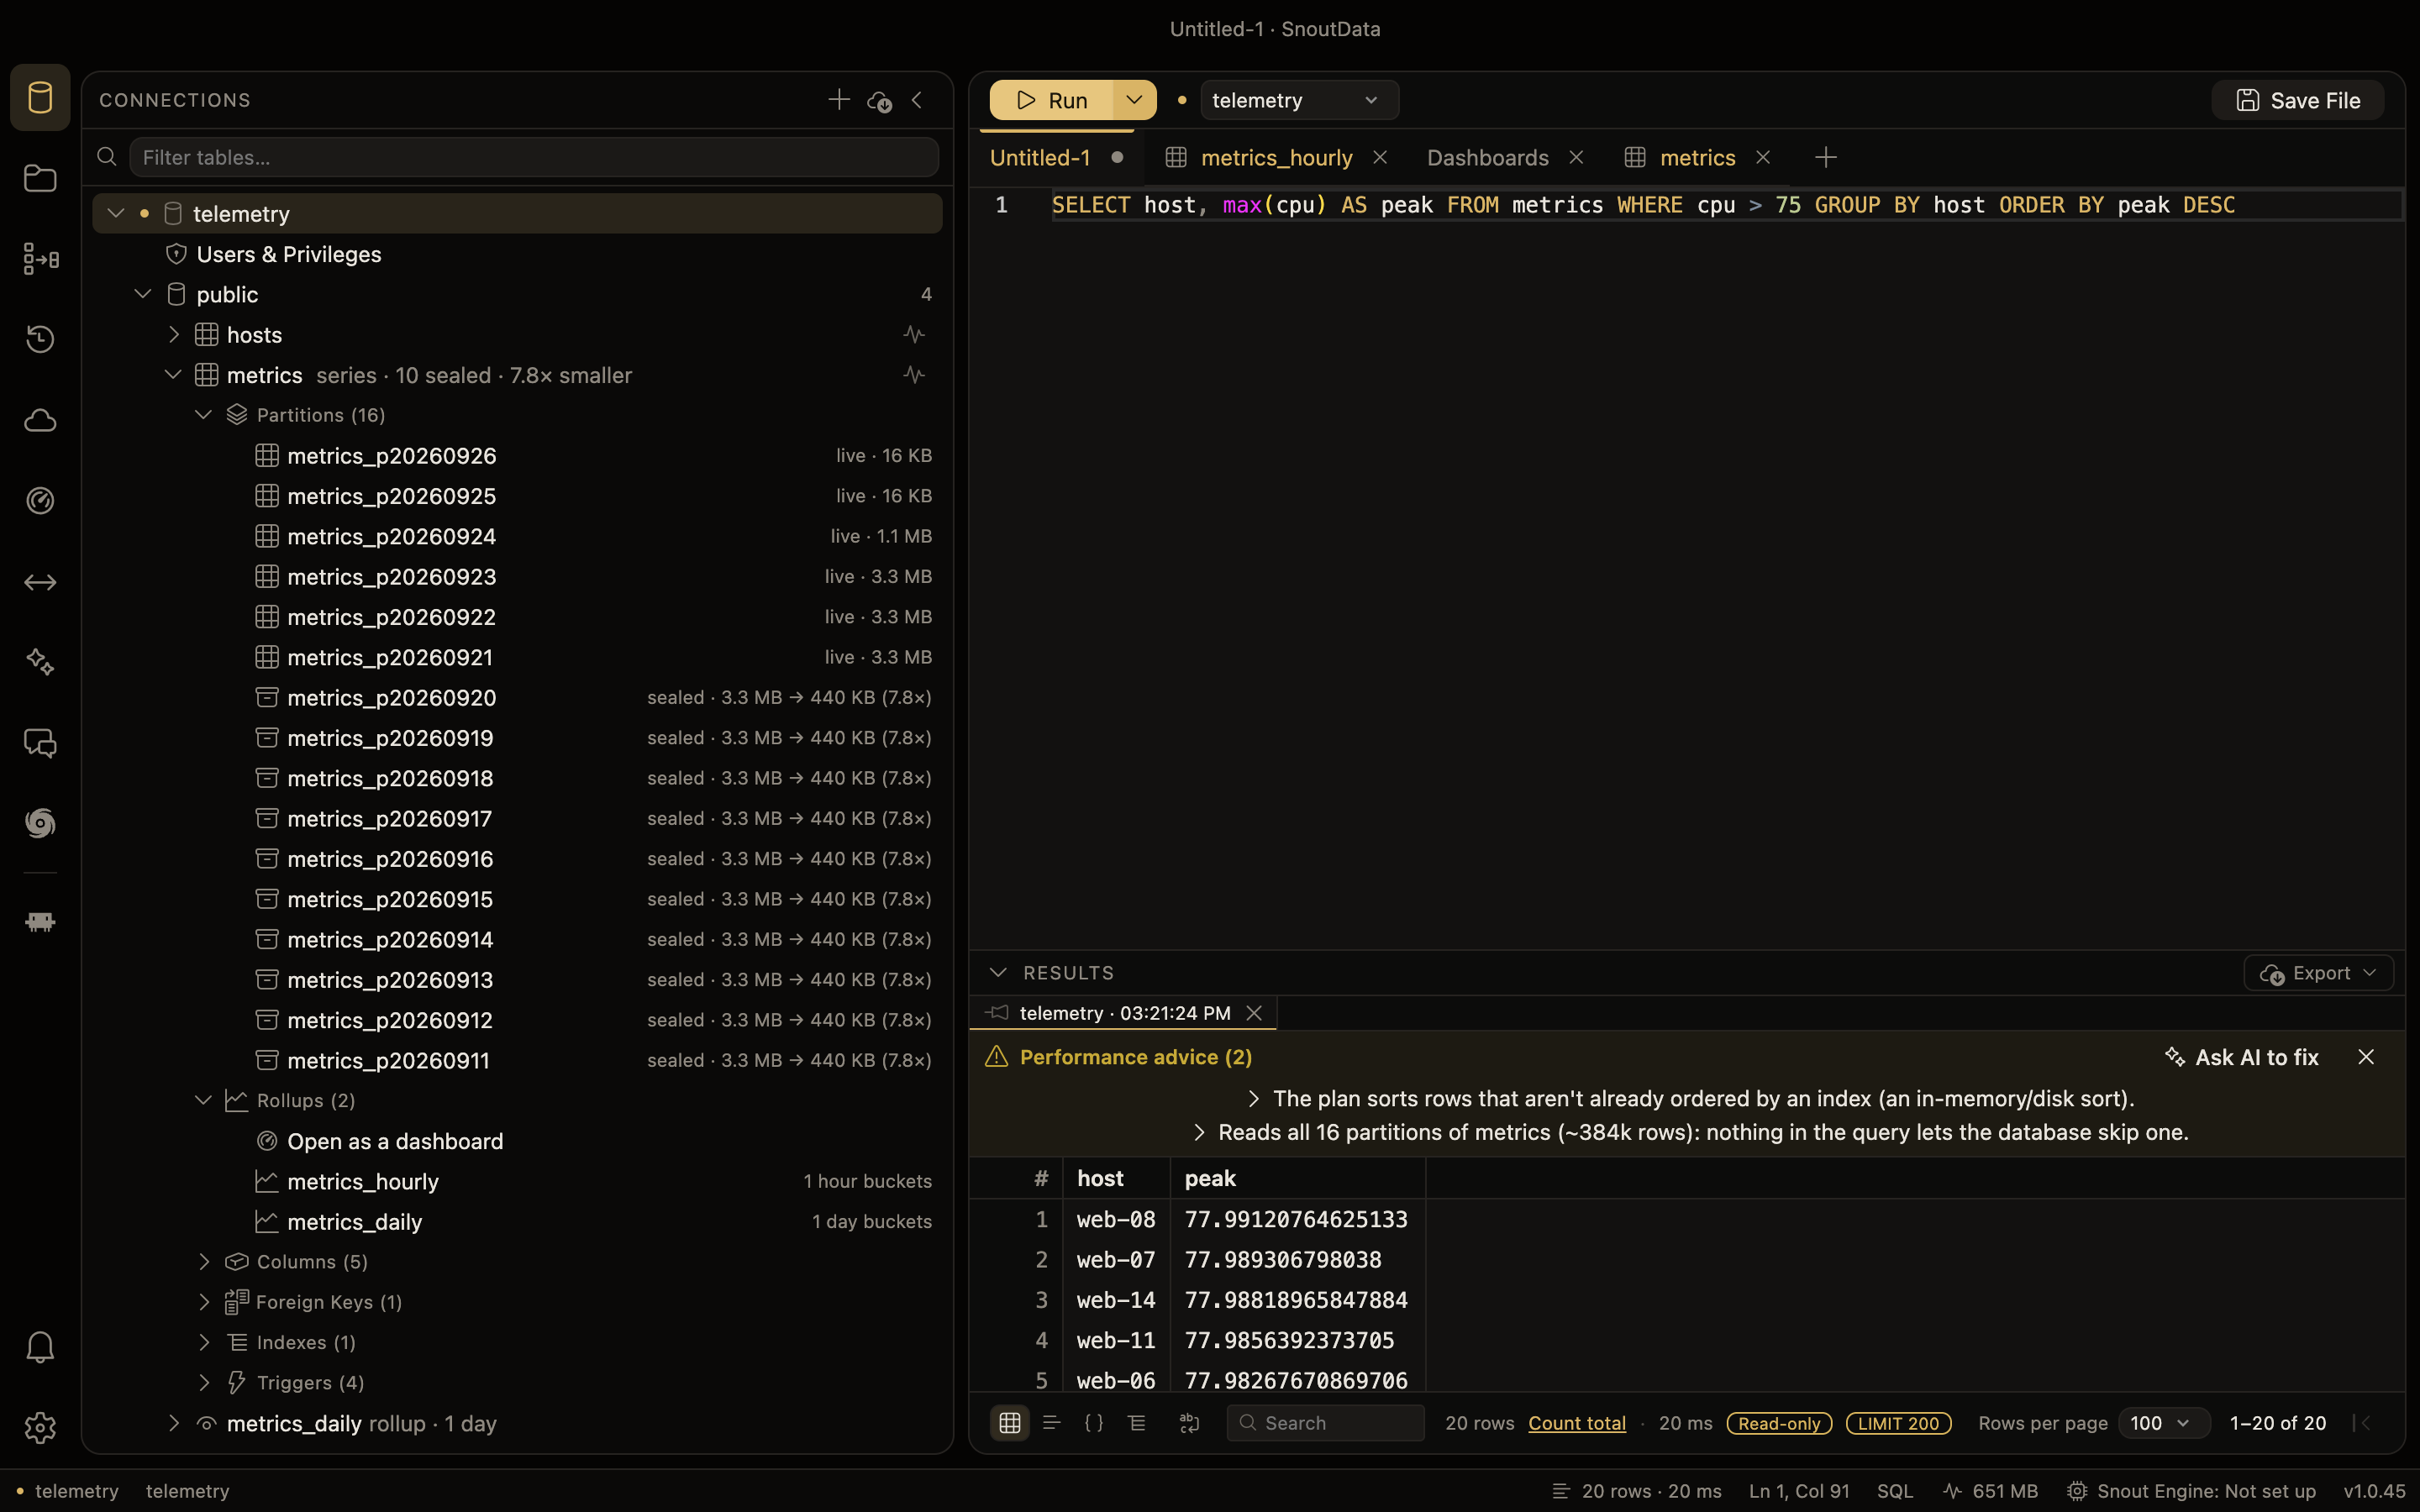
After a query that took a while, the app reads its plan and can show an advisory strip above the results (the Advise on index and scans setting, see Large datasets). On a partitioned table, when nothing in the query let Postgres skip a partition, you get one warning for the table instead of one per partition:
Reads all 30 partitions of metrics (~43M rows): nothing in the query lets the database skip one.
For a series table the explanation names its time column and says to filter on it with a range
Postgres can compare directly (ts >= now() - interval '1 day', or a literal range), never on a
function or a cast of it, such as date(ts) = current_date, which cannot prune. Ask AI to fix
hands the statement to the assistant. Reads of sealed partitions by SnoutTime's own scans count as
reads here too.
Open a series' rollups as a dashboard
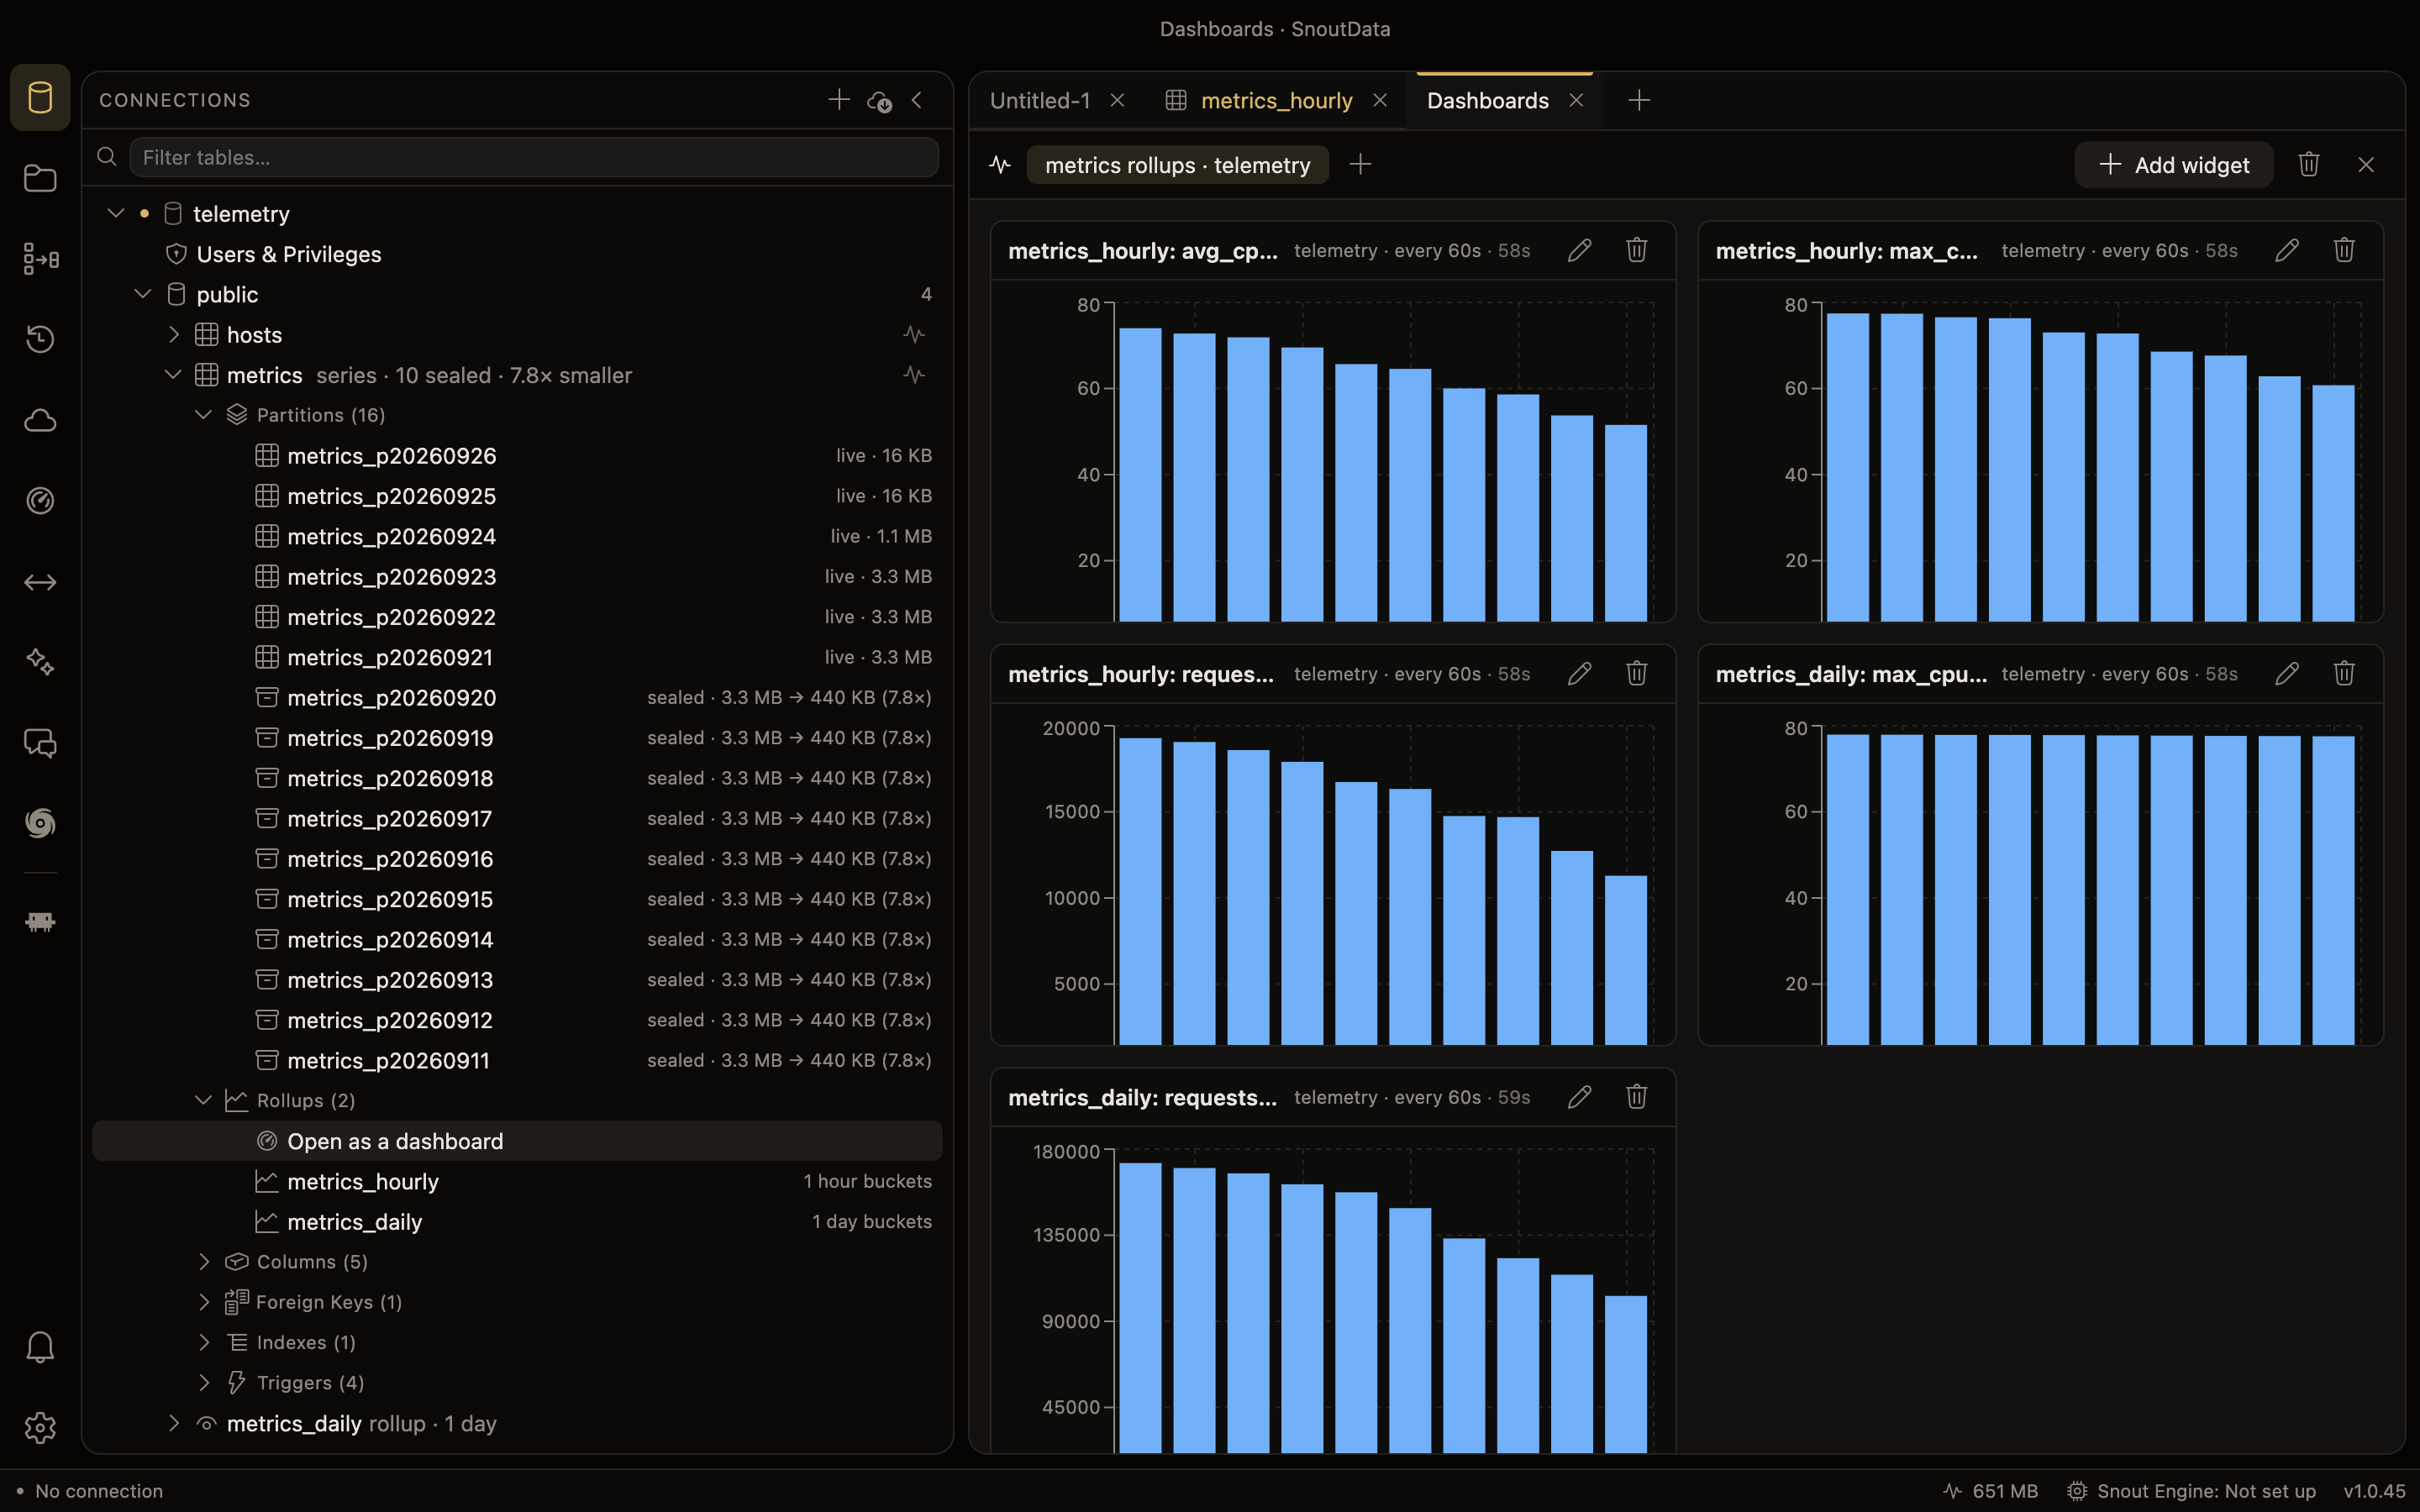
In a series table's Rollups folder, Open as a dashboard makes (the first time) and opens a dashboard with a widget for each rollup:
- a rollup without groups becomes a line chart of its last 48 buckets, one line per numeric column;
- a rollup with groups (per host, per device) becomes a bar chart per numeric column of the latest bucket's top ten groups.
Each widget re-reads its rollup once a minute. Because the history is already in the rollup, the charts are full the first time they open, and each poll reads a few dozen materialized rows rather than aggregating the raw table. The charts reach back from the newest bucket, not from now, so a series loaded with history, or one that has stopped receiving writes, still shows its data.
The dashboard's Time series tab
On dashboard.snoutdata.com, open a project and choose the Time series tab.
- When SnoutTime is off, the tab says so and offers Switch on SnoutTime, which runs
create extension if not exists snouttimeat once, with no restart. It is also in the Extensions tab (see Extensions). - When it is on, the tab header shows how many series tables the project has and the SnoutTime
version, then one card per series table with:
- its time column and type, partition size, space key if any, retention, and the range from its oldest partition to its newest;
- partitions (and how many SnoutTime did not make), estimated rows, total size, and Sealed: what the sealed partitions took before and take now, and the ratio;
- a warning when rows are waiting in the default partition;
- its rollups, with each one's bucket and retention;
- its jobs: kind, schedule, the last run (succeeded or failed, how long ago, how long it took, and the error when it failed) and the next run;
- Show partitions, which lists up to the 500 newest partitions with their state, range, rows,
size, and size before sealing. For more, query
snouttime.partition_infofrom the SQL tab.
- A notice at the top says when any job failed on its last run, and when the project is paused (no SnoutTime job runs until it wakes).
Every figure is read from SnoutTime's views, so row counts are the planner's estimates. Refresh reads them again.