Charts
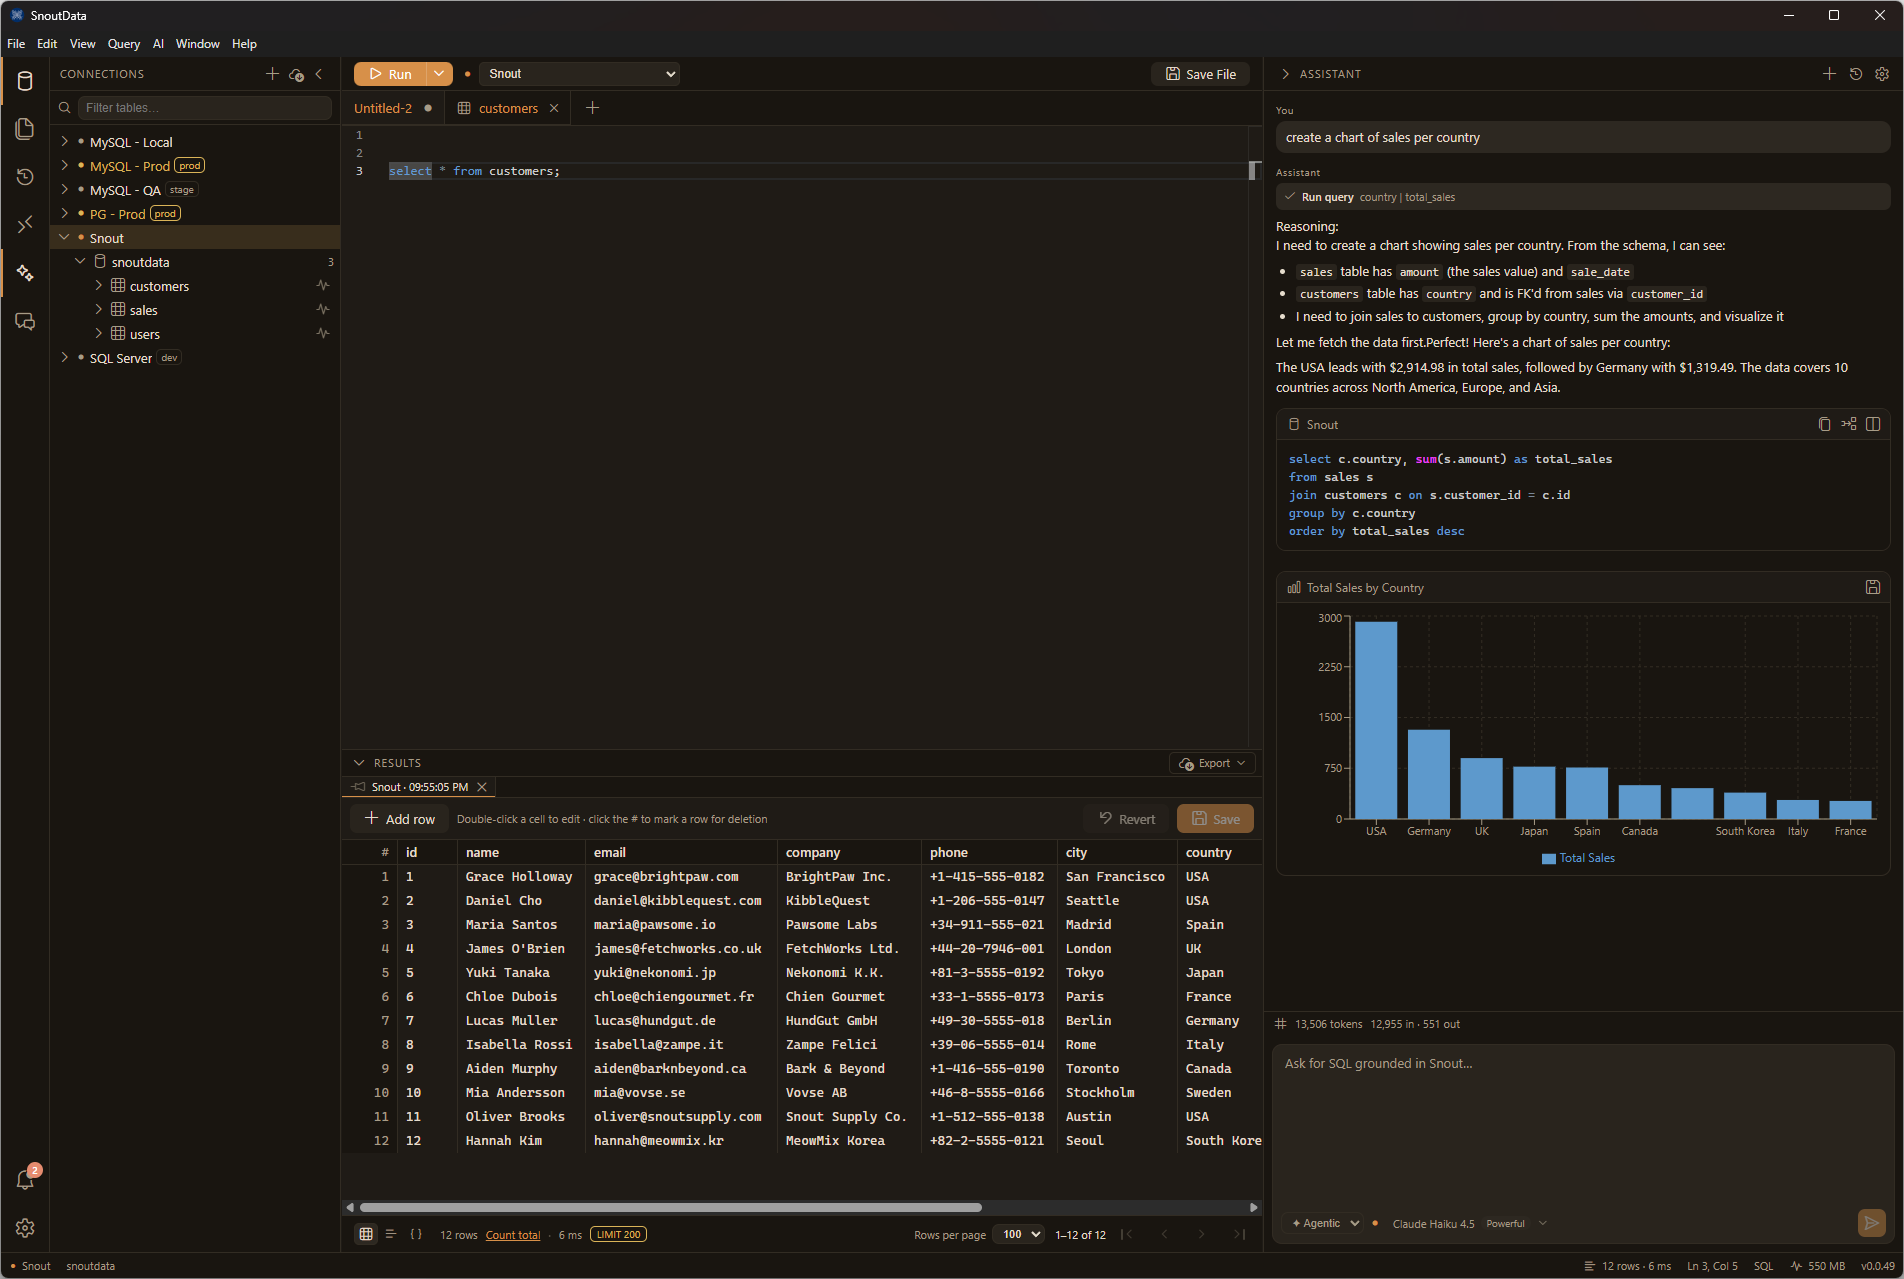
Turn a result set into a chart without leaving SnoutData. Run a query, then build a chart from its columns, or ask the AI assistant to chart a result for you.
Build a chart
- Run a query so its results are in the grid.
- Open the chart view and pick a chart type (for example, bar).
- Choose which column is the category (the x axis) and which is the value (the y axis).
The chart updates as you change the mapping. You can save the chart for later.
Charts from the AI assistant
Ask the assistant something like "chart users per country" and it will run the query and render the chart inline, with a short summary of what the data shows. See the AI assistant.